Mastering Tableau Dashboard Design:Principles and Best Practices
- nicerev
- 06 Jan, 2026
DOES DASHBOARD DESIGN BEST PRACTICE CREATE IMPACT?
- In the realm of data visualization, Tableau stands out as a powerful tool for creating insightful dashboards.
- It demands a keen understanding of design principles and best practices to ensure that data is not just displayed, but also understood and acted upon.
- In this blog post, we’ll explore some key principles and best practices for designing compelling Tableau dashboards, drawing insights from expert advice and industry standards.
LEVERAGING INTERACTIVE FEATURES
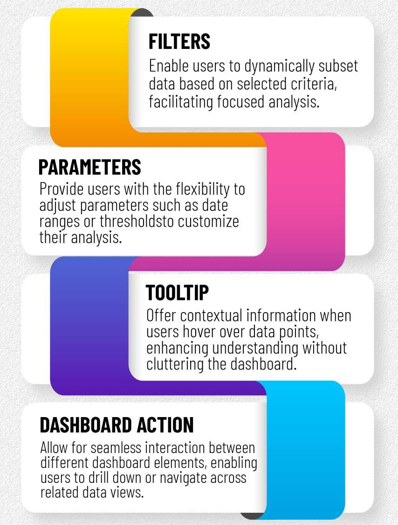
USER FEEDBACK
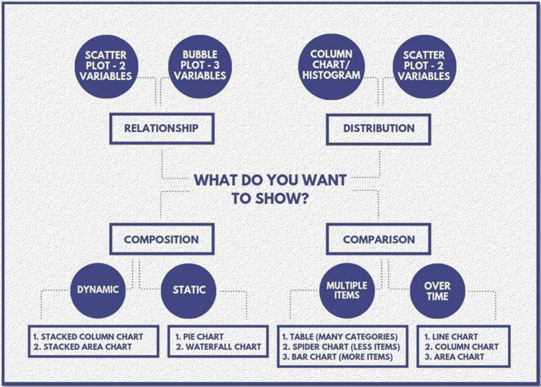
Collect user input to pinpoint issues and refine dashboard usability, focusing on improving the relationship between tables, the distribution of data points, chart composition, and time-based comparisons.
CONCLUSION
- Designing compelling Tableau dashboards requires a blend of creativity, technical skill, and an understanding of user needs.
- By following these principles and best practices, you can create dashboards that not only look great but also deliver meaningful insights to your audience.
- Whether you’re a seasoned Tableau user or just getting started, incorporating these principles into your dashboard design process can help you create more impactful visualizations.
AI solutions partnering with businesses to solve
complex challenges and thrive in the age of Data & AI.

Neeraj Deval
VP Professional Services
Recent Blogs
“Optimize business intelligence
for Organizational
Management System”- the
Agile approach
Client PortfolioThe customer is a leading financial firm having approximately 200 million customer accounts and doing business in
more than 160 countries with an inorganic growth over last 200 years, where standardizing and automating their
systems has been a tedious process so that they harness the massive data and capitalize for tangible insights into
data.
Business GoalImplement a dashboard to enable the in-business managers and stakeholders measure and manage their business
technology risk in accordance with the Managers Control Assessment.Key Business Concerns 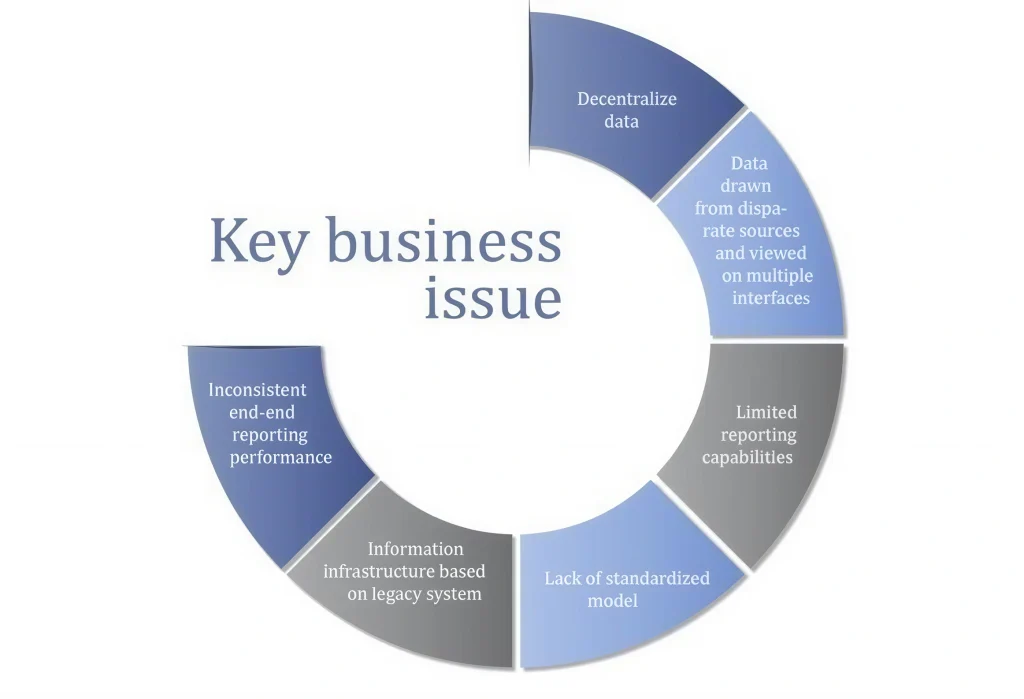 1. Nice Stratagem:
• Proffered a solution focusing on the key performance areas such as Continuity of Business indicators,
Outages by Entity, Technology Vulnerability, COB Invocation, Risk analysis and Change requests
• Designed an integrated system for monitoring and maintaining integrity and security throughout the
organization to avoid data infringement due to unauthorized access.
2. Optimized SolutionDeployment 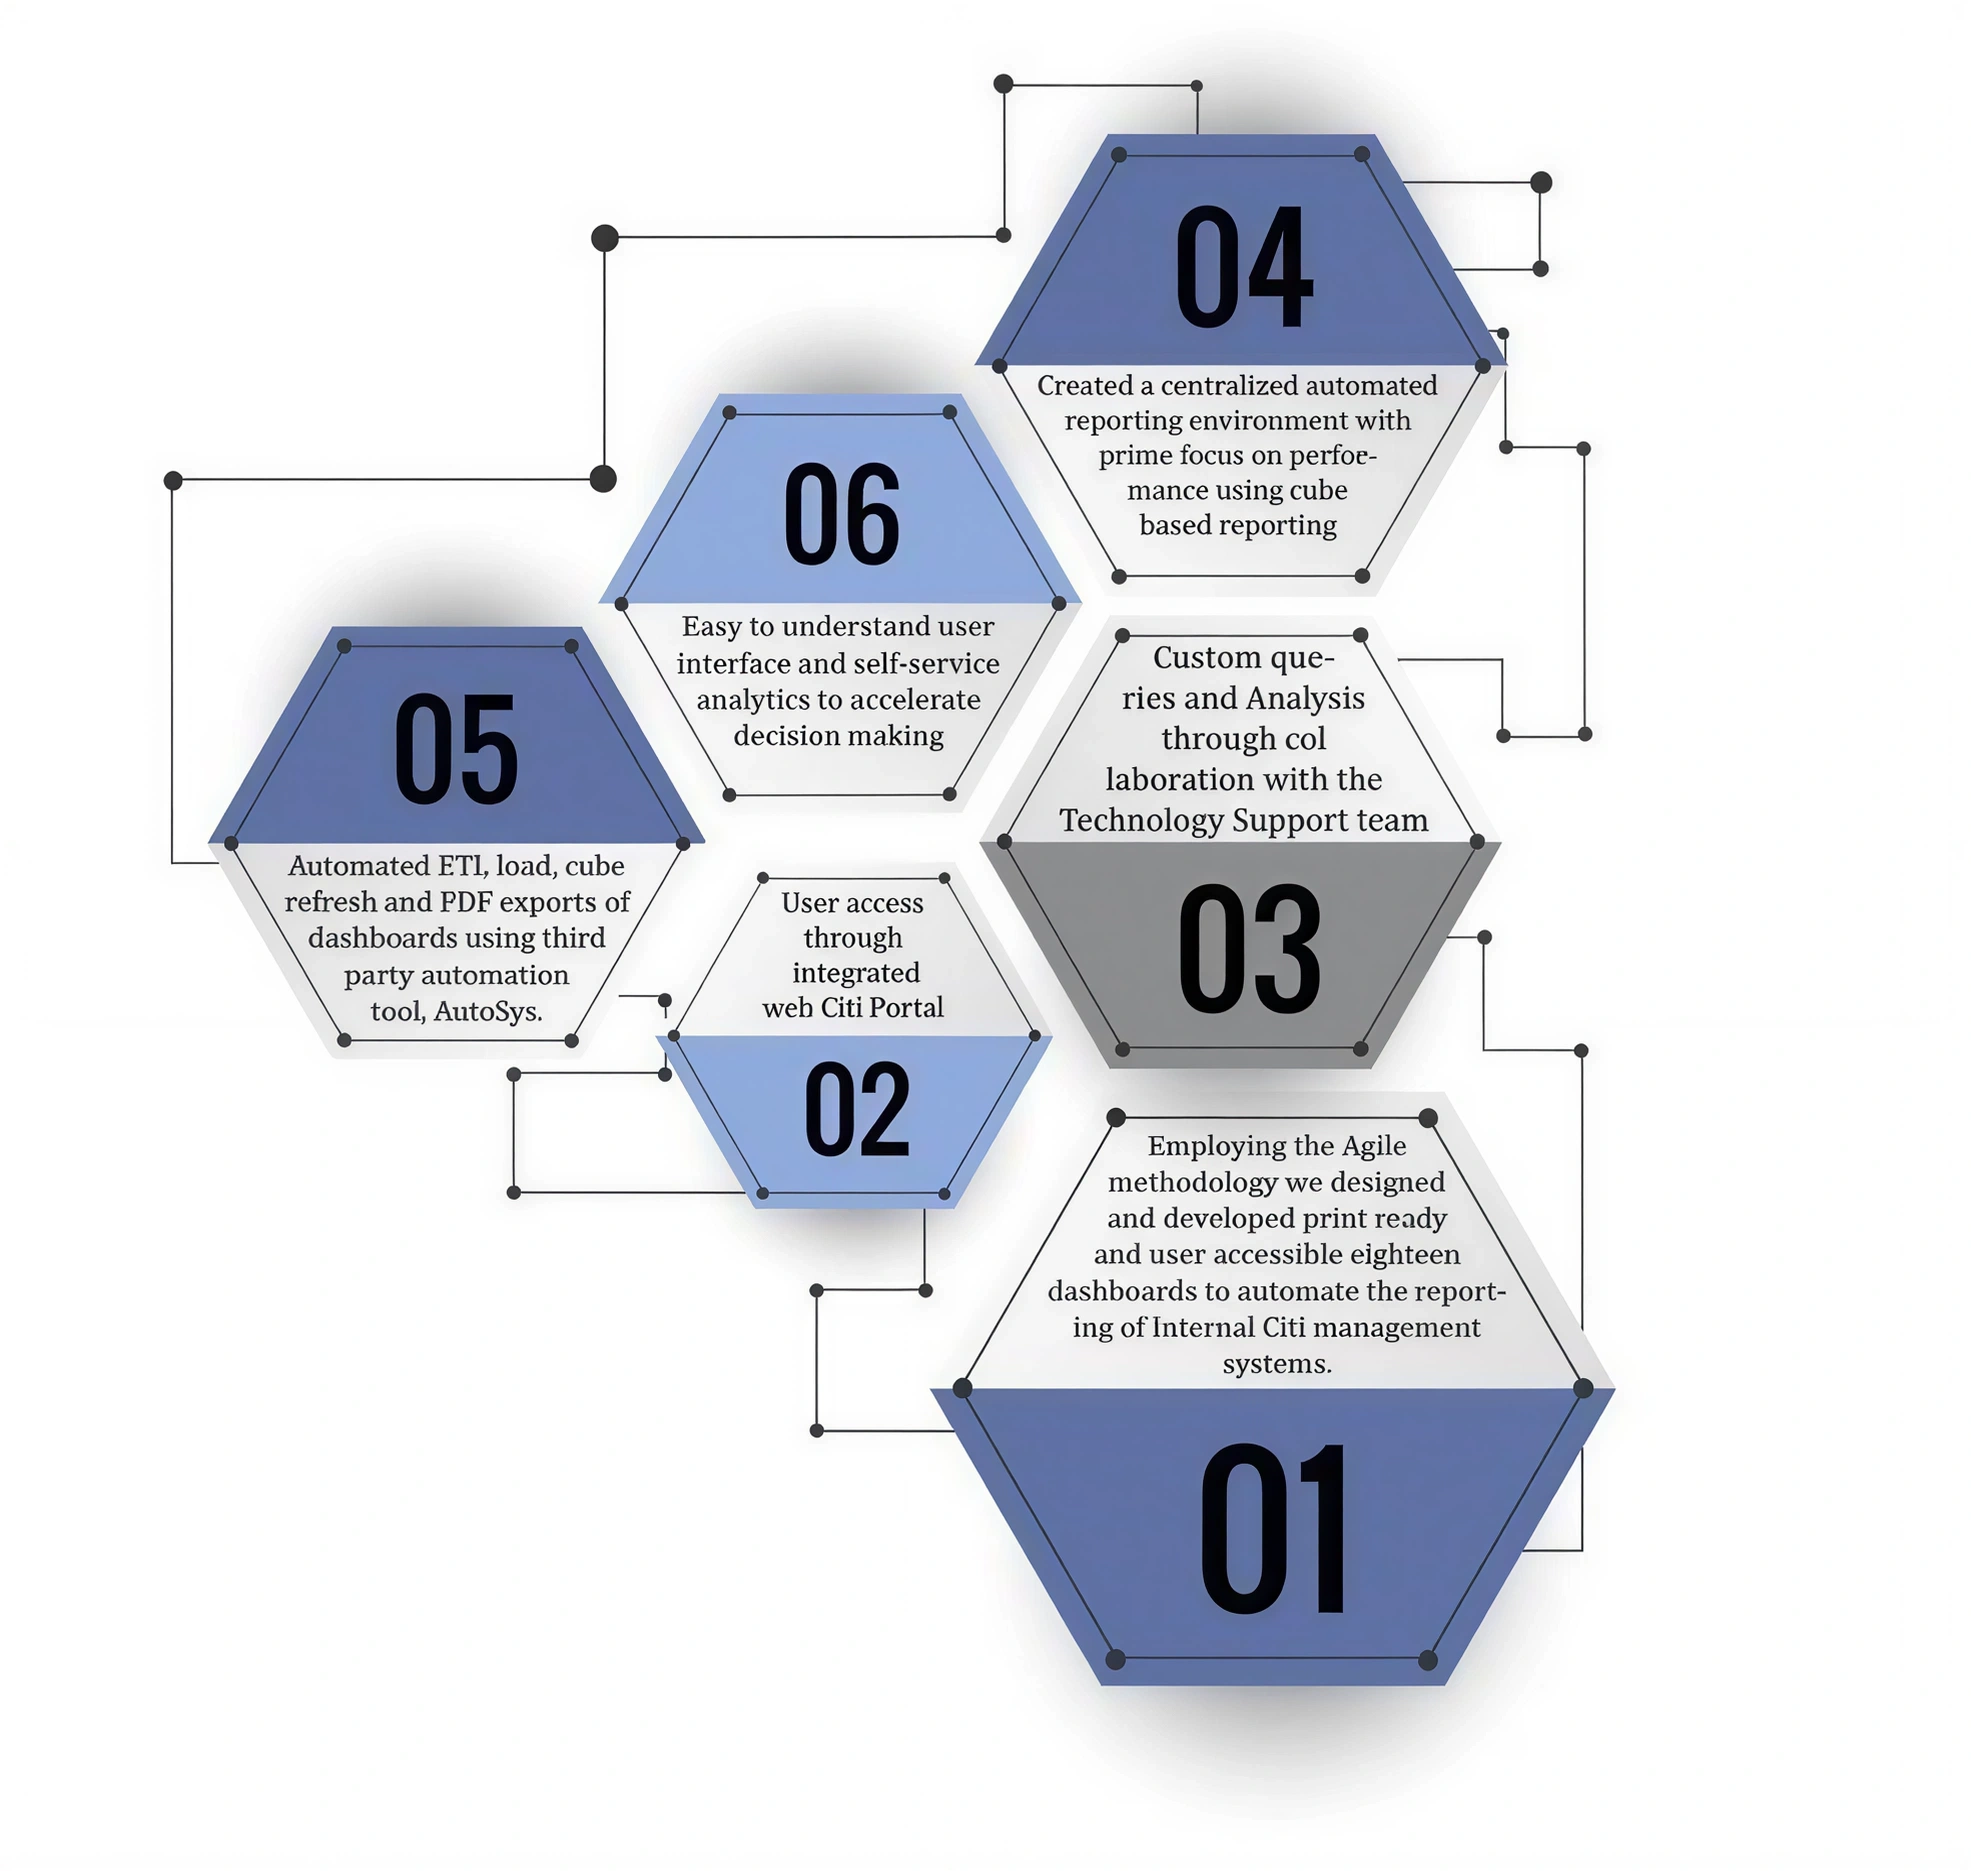 Definitives of Business Value
• Our data quality initiative has increased our clients’ confidence in warehouse-based reporting versus other
competent alternatives, and better quality awareness that improved data warehouse development practices.
• SSO customized security model handles the row level data security and regulates the data accessible to
different power users.
• The customized security model for data access has reduced the effort of re-development of multiple reports
with similar analysis.
• Our bespoke array of dashboard designs leveraging MicroStrategy’s intuitive point-and-click interface enabled
business users with powerful data exploration, faster business insight generation, and swifter sharing of
insights at all levels
Summary
• The dashboard addresses the usability issue which affected the adoption of the current set of reports, while
also enriching and expanding the content to include additional technology risk metric data sources.
• This dashboard and the underlying data was made available to Independent Risk Managers for independent
challenge and other risk management activities. The data will be leveraged to include activities related to the
identification of Technology Key Risk Indicators.
The “Nice” USP Our customized end-to-end BI solutions are employed by leading financial organizations and firms to improve speed
and agility, for risk aversion, enable calculated decision-making, and drive down costs. We understand and foresee
that our BI solutions will be an extension to their current reporting capabilities. Our value proposition lies in our
personalized approach to provide solutions to client’s technical, function and non-functional needs.To learn more about our innovative functional and technical workshops, prototype designing activities, customized
onsite and online trainings, educative handholding sessions and end user specific interactive videos and courses,
please visit us www.nicesoftwaresolutions.com
or email us at info@nicesoftwaresolutions.com.
Know More About Our Banking Services
Recent Case Study


")


")


