Menu
Menu
BUSINESS INTELLIGENCE
SOLUTIONS FOR LIFE
SCIENCES INDUSTRY
Business Challenge
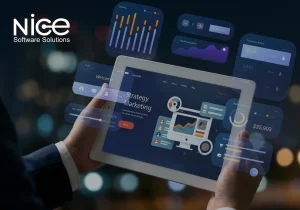
To design an application showing relevant information to the ‘Field Representatives’ and ‘Frontline Managers ’.This
application should provide access to quick and accurate information about Sales and Activity. It should contain simple
yet informative grids and graphs that would assist in quick analysis. The dashboards should be available on iPad
devices with offline functionality as well as on client portal for online analysis.
Our Solution
NSS customized an end-to-end solution to meet the pharma company’s key objectives through the following
deployment:
1. MicroStrategy
a. Dashboards were designed to be viewed by following types of users on Web and iPad:
- TS – Should see the data for his territory i.e. Territory Level data
- RSM – Should see the data for all the territories coming under his region as well as the aggregated
region level data - Country Power User – Should see the data for all the regions and territories coming under the
respective country
b. User Security: Security was applied based on the User Login (Single Sign-On) for TS and RSM users, and
country-wise security was used for the Country Power Users.
c. The TS dashboards were divided as follows depending on the type of data the country had:
- Variant1 Countries – Having Sales and Activity Data
- Variant2 Countries – Having Ex-Factory and Activity Data
d. There is a fourth type of user called ‘Super Power User’ who has access to the data of all TS and RSM’s of all
countries.
e. Our solution showed the KPI’s with respect to each country. We provided offline functionality to TS and
RSM users.
f. MSTR Functionalities used:
- Thresholds
- Conditional Formatting
- Prompts
- Case Metrics
- Pass through functions
- Compound Attributes
- Security Filters
- Grids/Graphs
2. ETL
a.The NSS ETL team handled data coming from 3 different data sources: G360 (Activity Data), IMS (Sales
Data), EBS (Ex-Factory Data).
b.The ETL team did a great job reducing the cube size. At a very high point in the project there was a change
in the user security. There was also a major change in the backend tables with some minor changes in the
MicroStrategy security filters.
c.This was followed by a rigorous regression testing.
Our Role
- Project Management
- Architecture design, Installation and technology solution
- Requirement gathering, data analysis and data modelling
- BI application designing and development
- End user training
The “Nice” USP
Our customized end-to-end BI solutions empower our customers to explore many more opportunities for benefits by
exploiting their investment in any BI platform. We understand and foresee that our BI solutions will be an extension to
their current reporting capabilities. Our USP lies in our personalized approach to provide solutions to client’s technical,
function and non-functional needs. To learn more about our innovative functional and technical workshops, prototype
designing activities, customized onsite and online trainings, educative handholding sessions and end user specific
interactive videos and courses, please visit us at www.nicesoftwaresolutions.com
or email us at
info@nicesoftwaresolutions.com.
Recent Case Study

Team Analysis View as Microsoft Teams Hierarchy
06 Jan, 2026
Power Bi Report Embedding
06 Jan, 2026
MSTR To Power Bi Migration
06 Jan, 2026
Embedding Power Bi Report
06 Jan, 2026


")


")


